第286篇:数据中心网络运维 AI 辅助分析
关键词:AI运维、AIOps、异常检测、根因分析、智能告警、机器学习、网络可观测性
一、引言
随着数据中心规模的持续增长和网络复杂度的不断提升,传统基于规则的网络运维方式已难以满足需求。告警风暴、故障定位慢、根因分析困难等问题日益突出。
AI辅助网络运维(AIOps for Network)利用机器学习和数据分析技术,从海量Telemetry数据和告警日志中自动发现异常、定位根因、预测风险,将运维模式从"被动响应"转变为"主动预防"。
二、AIOps 核心能力体系
2.1 AI 运维能力矩阵
| 能力 | 传统运维 | AI运维 | 效果提升 |
|---|---|---|---|
| 异常检测 | 固定阈值 | 自适应基线 | 准确率提升3-5倍 |
| 告警降噪 | 手动规则 | 智能关联聚合 | 告警量减少80-90% |
| 根因分析 | 人工排查 | 自动拓扑推理 | 定位时间从小时级降至分钟级 |
| 容量预测 | 经验判断 | 时序预测模型 | 容量规划精度提升50% |
| 故障预测 | 无 | 趋势预测 | 提前24-72小时预警 |
2.2 AI 运维架构
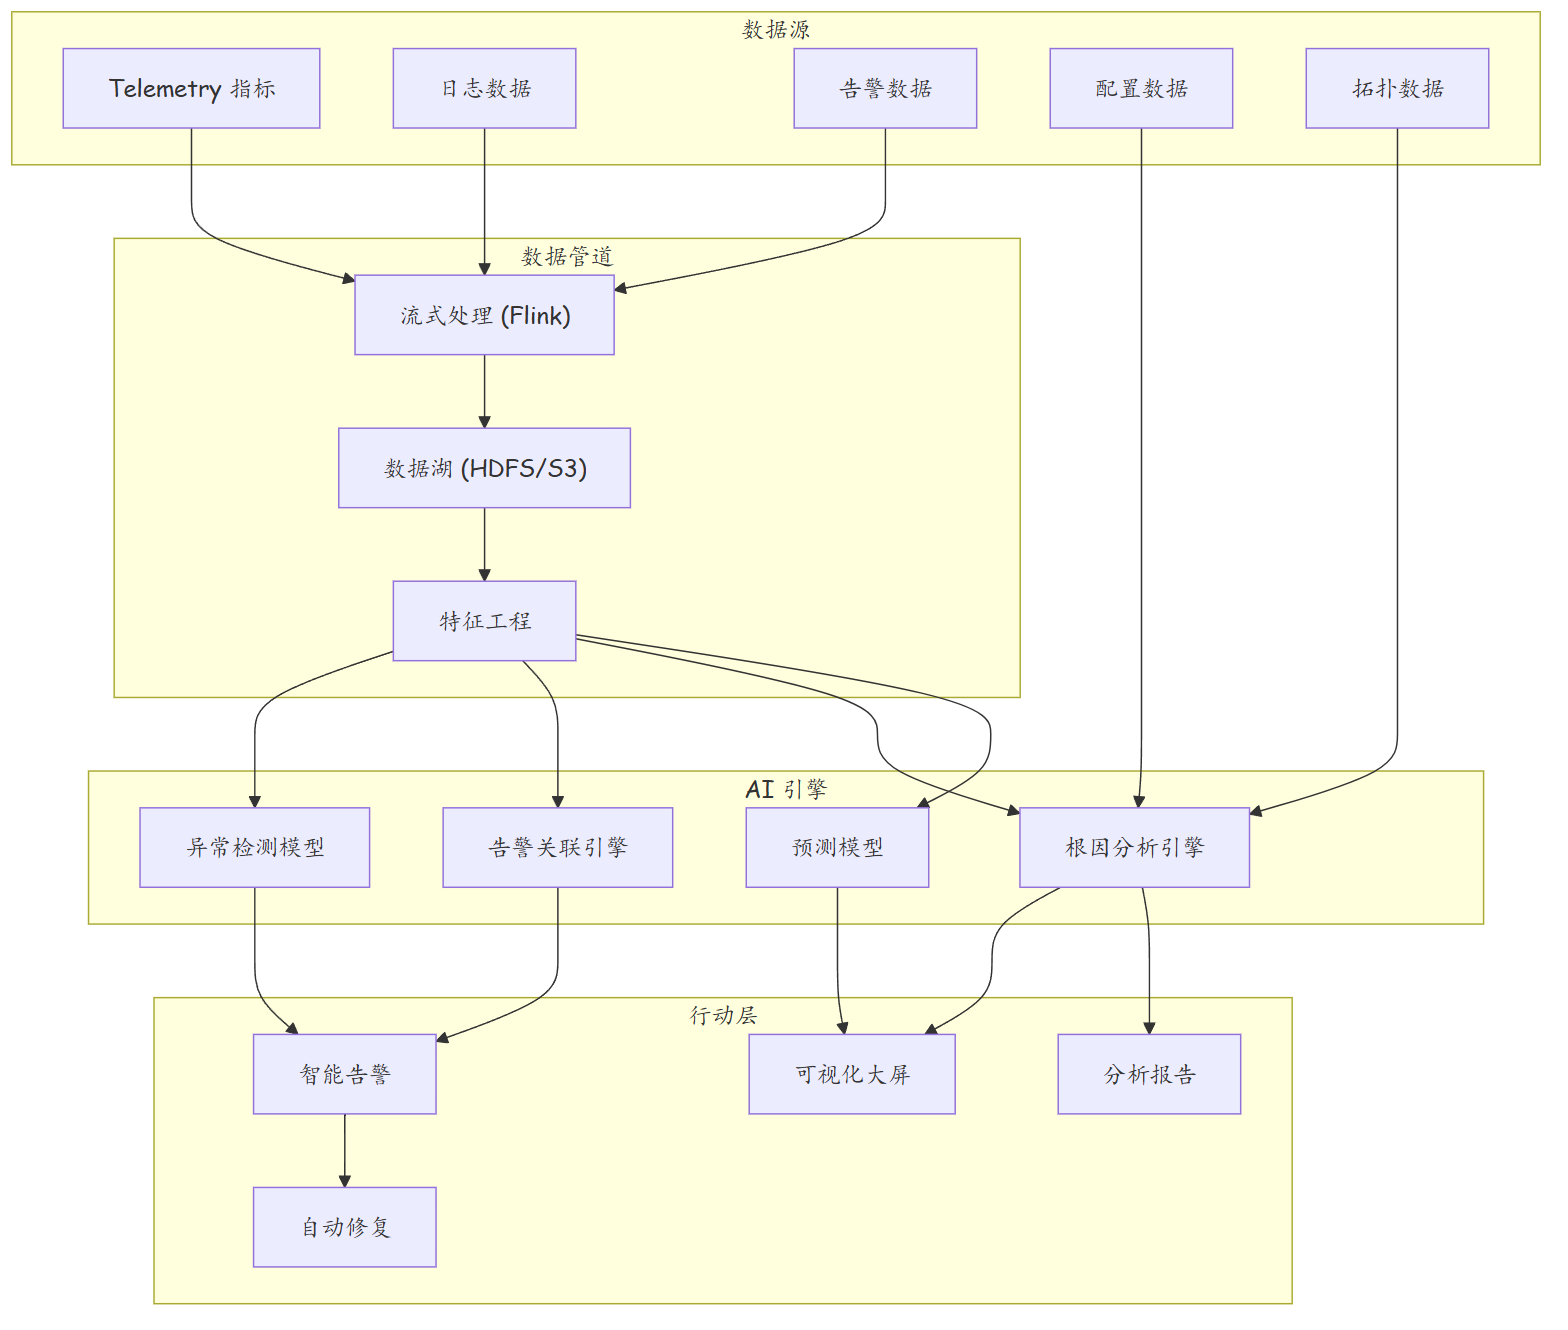
三、AI 异常检测技术
3.1 异常检测方法对比
| 方法 | 类型 | 适用场景 | 优点 | 缺点 |
|---|---|---|---|---|
| 3σ规则 | 统计方法 | 稳定周期数据 | 简单快速 | 无法处理突变 |
| EWMA | 统计方法 | 带趋势的数据 | 平滑噪声 | 对突发异常不敏感 |
| Isolation Forest | 无监督学习 | 多特征异常检测 | 无需标注 | 需要调参 |
| LSTM-AE | 深度学习 | 时序异常检测 | 捕捉复杂模式 | 训练成本高 |
| Prophet | 时间序列 | 周期性+趋势数据 | 自动识别季节 | 对突变不敏感 |
| 孤立森林+聚类 | 混合方法 | 多维指标异常 | 综合效果好 | 计算开销大 |
3.2 基于 LSTM 的异常检测
import numpy as np
import tensorflow as tf
from tensorflow.keras.models import Model
from tensorflow.keras.layers import LSTM, Dense, RepeatVector, TimeDistributed

class LSTMAnomalyDetector:
    """基于LSTM自编码器的网络指标异常检测器"""

    def __init__(self, sequence_length=60, features=5):
        """
        Args:
            sequence_length: 时间窗口长度(例如60个采样点=10分钟)
            features: 特征维度(如in_octets, out_octets, cpu, memory, packet_loss)
        """
        self.sequence_length = sequence_length
        self.features = features
        self.model = self._build_model()

    def _build_model(self):
        """构建LSTM自编码器"""
        inputs = tf.keras.Input(
            shape=(self.sequence_length, self.features)
        )

        # 编码器
        encoded = LSTM(64, activation='relu', return_sequences=True)(inputs)
        encoded = LSTM(32, activation='relu')(encoded)

        # 解码器
        decoded = RepeatVector(self.sequence_length)(encoded)
        decoded = LSTM(32, activation='relu', return_sequences=True)(decoded)
        decoded = LSTM(64, activation='relu', return_sequences=True)(decoded)
        decoded = TimeDistributed(Dense(self.features))(decoded)

        model = Model(inputs, decoded)
        model.compile(optimizer='adam', loss='mse')
        return model

    def train(self, X_train, epochs=50, batch_size=32):
        """训练模型(仅使用正常数据)"""
        history = self.model.fit(
            X_train, X_train,  # 自编码器: 输入=输出
            epochs=epochs,
            batch_size=batch_size,
            validation_split=0.1
        )
        return history

    def predict_anomaly(self, X_test, threshold=None):
        """
        预测异常
        Returns:
            anomaly_scores: 每个样本的重建误差
            anomalies: 布尔数组, True表示异常
        """
        reconstruction = self.model.predict(X_test)

        # 计算MSE作为异常分数
        mse = np.mean(np.power(X_test - reconstruction, 2), axis=(1, 2))

        if threshold is None:
            # 使用训练数据的95百分位作为阈值
            threshold = np.percentile(mse, 95)

        anomalies = mse > threshold
        return mse, anomalies, threshold

    def detect_interface_anomaly(self, interface_metrics):
        """
        检测接口流量异常

        Args:
            interface_metrics: list of dicts, 每个dict包含:
                in_octets, out_octets, in_packets, out_packets, error_count
        Returns:
            anomaly_result: 异常检测结果
        """
        # 转换为numpy数组
        features = ['in_octets', 'out_octets', 'in_packets', 'out_packets', 'error_count']
        data = np.array([[m[f] for f in features] for m in interface_metrics])

        # 归一化
        mean = np.mean(data, axis=0)
        std = np.std(data, axis=0)
        data_normalized = (data - mean) / (std + 1e-8)

        # 滑动窗口构造序列
        sequences = []
        for i in range(len(data_normalized) - self.sequence_length + 1):
            sequences.append(data_normalized[i:i + self.sequence_length])

        X = np.array(sequences).reshape(-1, self.sequence_length, self.features)

        scores, anomalies, threshold = self.predict_anomaly(X)

        return {
            'anomaly_scores': scores,
            'is_anomaly': anomalies,
            'threshold': threshold,
            'anomaly_count': int(np.sum(anomalies)),
            'total_samples': len(X)
        }


# 使用示例
if __name__ == "__main__":
    detector = LSTMAnomalyDetector(sequence_length=60, features=5)

    # 使用正常历史数据训练
    # X_train形状: (n_samples, 60, 5)
    # history = detector.train(X_train)

    # 检测新数据中的异常
    # result = detector.detect_interface_anomaly(new_metrics)
    # print(f"异常比例: {result['anomaly_count']}/{result['total_samples']}")
3.3 基于 Isolation Forest 的多维异常检测
from sklearn.ensemble import IsolationForest
import pandas as pd

class NetworkAnomalyDetector:
    """网络多维异常检测器"""

    def __init__(self, contamination=0.05):
        """
        Args:
            contamination: 异常值比例预估
        """
        self.contamination = contamination
        self.detectors = {}  # 每类指标一个检测器

    def train_multi_dimensional(self, data: pd.DataFrame, metric_groups: dict):
        """
        为不同维度分别训练异常检测器

        Args:
            data: DataFrame, 包含所有监控指标
            metric_groups: dict, 按维度分组
                {
                    'interface': ['in_octets', 'out_octets', 'in_errors'],
                    'system': ['cpu_usage', 'memory_usage', 'temperature'],
                    'bgp': ['bgp_peer_up', 'route_count']
                }
        """
        for group_name, features in metric_groups.items():
            # 只取数值列
            numeric_cols = [f for f in features if f in data.columns]
            X = data[numeric_cols].dropna()

            if len(X) < 100:
                continue

            clf = IsolationForest(
                n_estimators=100,
                contamination=self.contamination,
                random_state=42,
                n_jobs=-1
            )
            clf.fit(X)
            self.detectors[group_name] = {
                'model': clf,
                'features': numeric_cols
            }

    def detect(self, data: pd.DataFrame) -> dict:
        """多维异常检测"""
        results = {}
        for group_name, detector_info in self.detectors.items():
            model = detector_info['model']
            features = detector_info['features']

            X = data[features].dropna()
            if X.empty:
                continue

            # 预测: -1=异常, 1=正常
            predictions = model.predict(X)
            scores = model.decision_function(X)

            anomalies = X[predictions == -1]

            results[group_name] = {
                'anomaly_count': len(anomalies),
                'total_count': len(X),
                'anomaly_ratio': len(anomalies) / len(X) if len(X) > 0 else 0,
                'anomalies': anomalies
            }

        return results
四、智能告警与根因分析
4.1 告警降噪与关联
告警关联维度:
| 关联维度 | 说明 | 权重 |
|---|---|---|
| 时间关联 | 同一时间段内发生的告警 | 高 |
| 拓扑关联 | 相邻设备的告警 | 高 |
| 类型关联 | 相同告警类型的聚合 | 中 |
| 因果关联 | 上游故障导致的下游告警 | 高 |
class AlarmCorrelationEngine:
    """告警关联引擎"""

    def __init__(self, time_window=300):
        """
        Args:
            time_window: 时间窗口(秒), 同一窗口内的告警视为关联
        """
        self.time_window = time_window

    def correlate_alarms(self, alarms: list, topology: dict) -> list:
        """
        关联告警,输出根因告警

        Args:
            alarms: 告警列表,每个告警包含:
                {id, device, type, severity, timestamp, ...}
            topology: 拓扑信息, 包含设备邻居关系
        Returns:
            correlated_groups: 关联组列表
        """
        # 按时间窗口分组
        time_groups = self._group_by_time(alarms)

        correlated_groups = []
        for group in time_groups:
            # 按拓扑关联
            topo_clusters = self._cluster_by_topology(group, topology)

            for cluster in topo_clusters:
                # 确定根因告警(最早+最高严重度)
                root_cause = self._find_root_cause(cluster, topology)

                correlated_groups.append({
                    'root_cause_alarm': root_cause,
                    'related_alarms': cluster,
                    'affected_devices': list(set(a['device'] for a in cluster)),
                    'correlation_confidence': self._calculate_confidence(cluster)
                })

        return correlated_groups

    def _find_root_cause(self, cluster: list, topology: dict) -> dict:
        """
        寻找根因告警
        策略: 最早的告警 + 上游设备的告警
        """
        # 按时间排序
        sorted_alarms = sorted(cluster, key=lambda x: x['timestamp'])

        # 检查是否有上游设备(根据拓扑)
        for alarm in sorted_alarms:
            device = alarm['device']
            # 如果此设备是其他告警设备的上游, 优先作为根因
            is_upstream = any(
                alarm['device'] in topology.get(device, {}).get('downstream', [])
                for alarm in cluster if alarm['device'] != device
            )
            if is_upstream:
                return alarm

        # 否则返回最早的告警
        return sorted_alarms[0]
4.2 根因分析流程
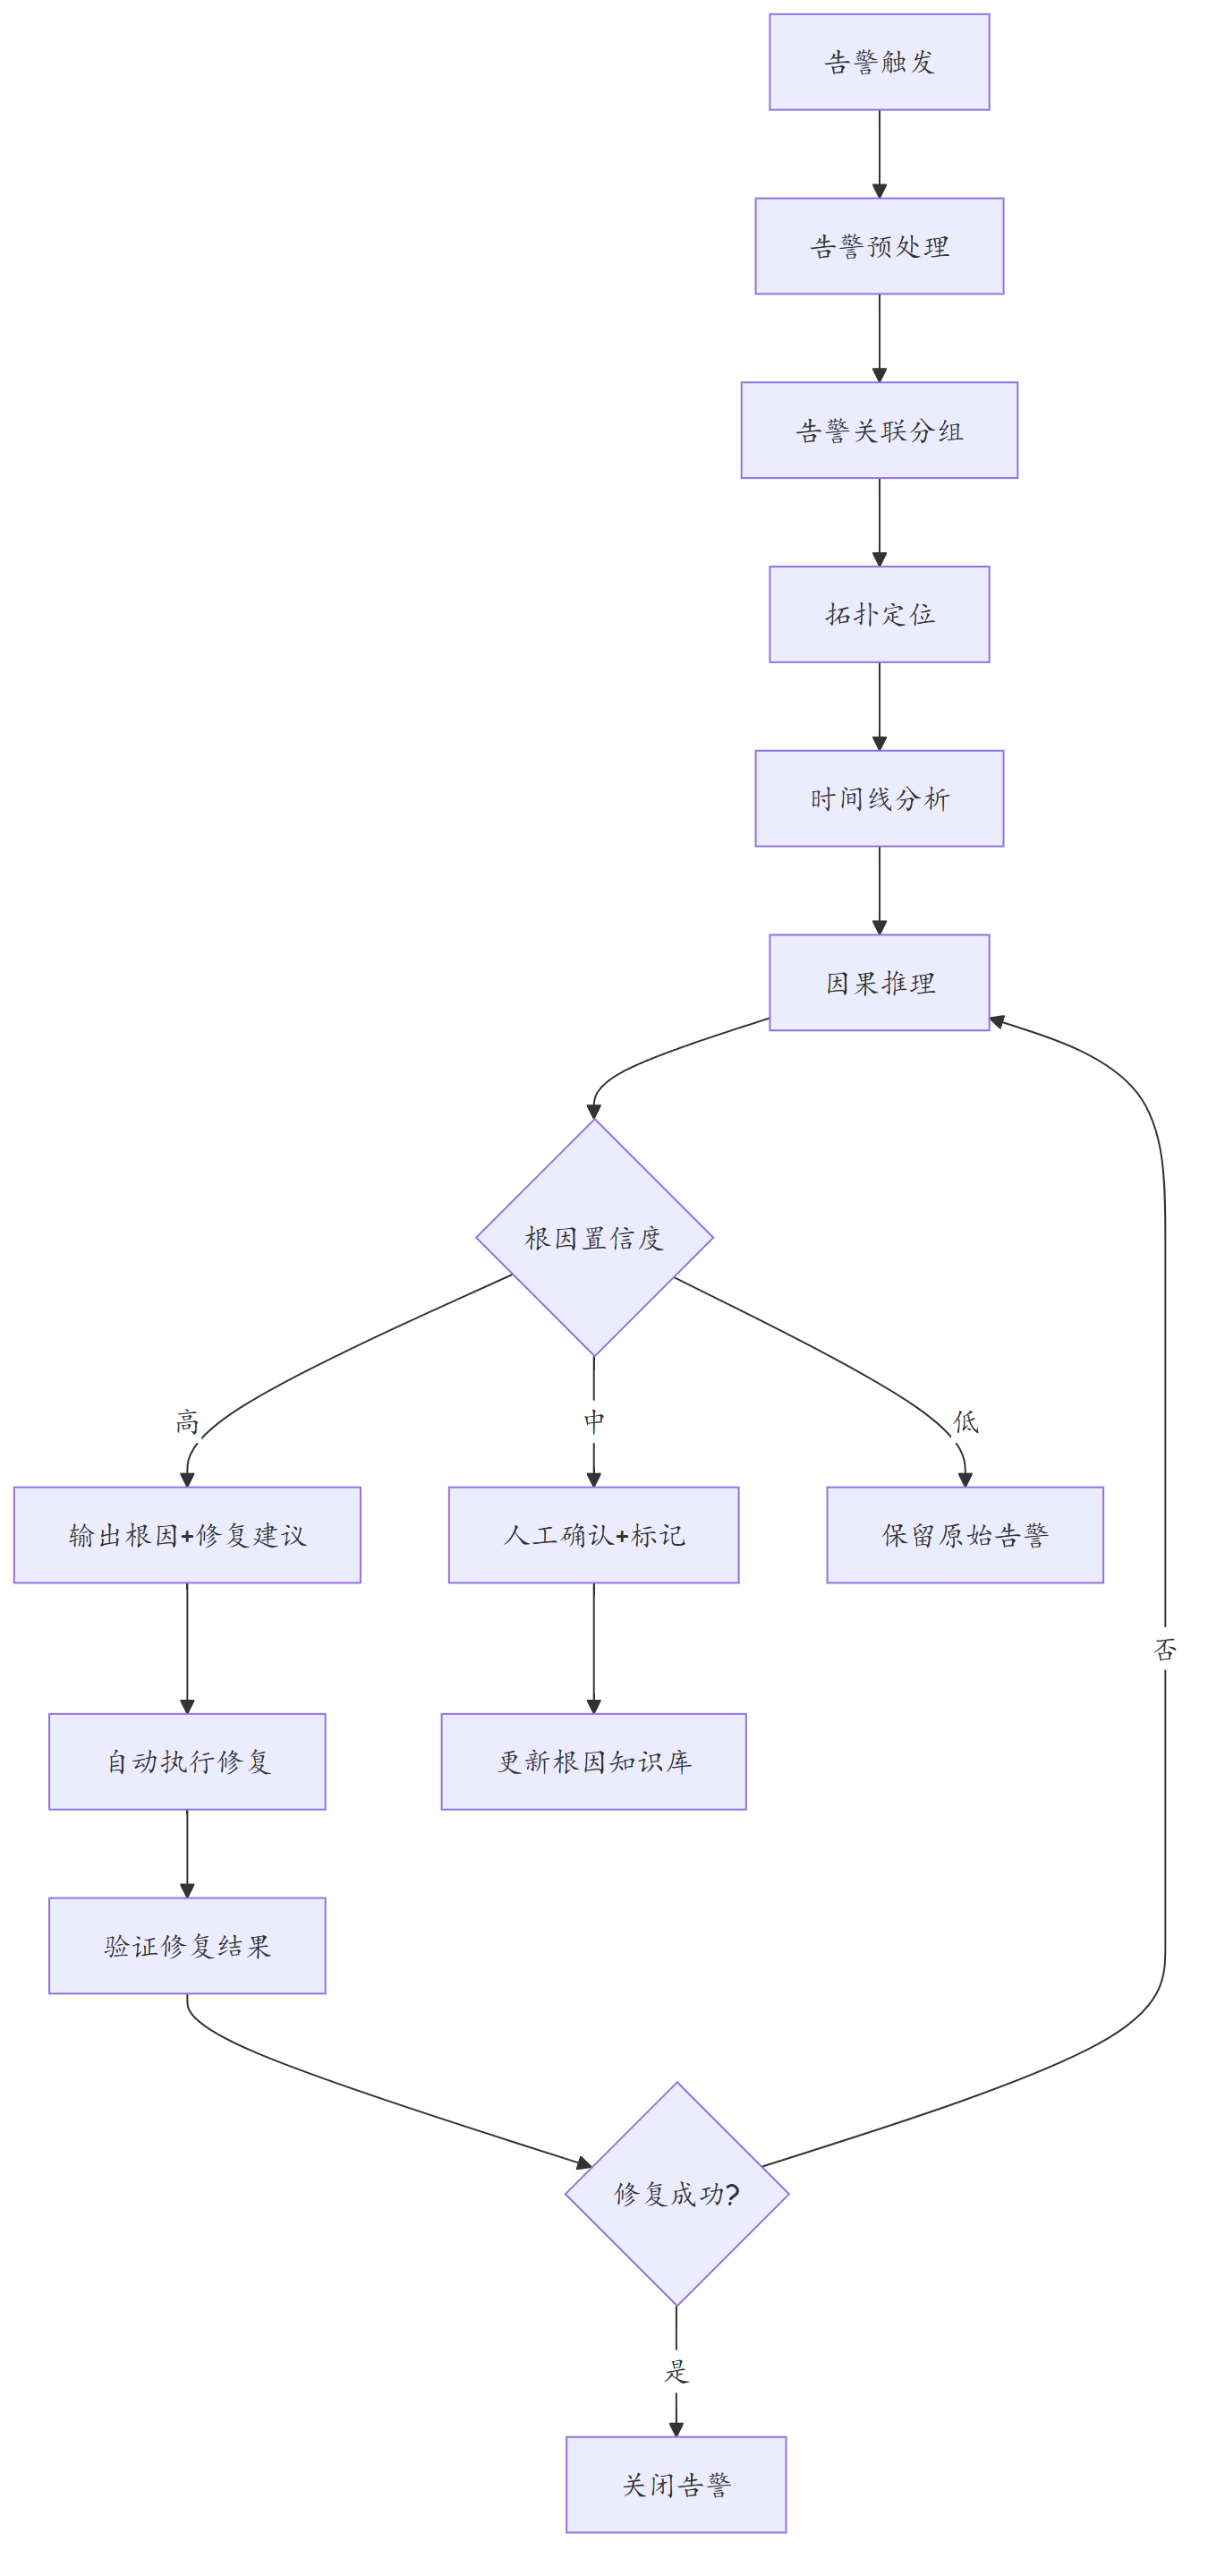
4.3 根因知识库
| 故障模式 | 典型告警组合 | 根因设备位置 | 修复建议 |
|---|---|---|---|
| 光模块故障 | 接口Down+CRC错误+BFD告警 | 接口端设备 | 更换光模块 |
| 链路拥塞 | 接口利用率>95%+队列丢包+时延增加 | 拥塞链路两端 | 流量迁移/扩容 |
| BGP会话中断 | BGP Down+路由消失+流量中断 | BGP会话对端 | 检查底层连接/路由 |
| 设备高CPU | CPU>90%+SNMP超时+配置下发慢 | 高CPU设备 | 分析CPU占用进程/优化配置 |
| 路由震荡 | 路由频繁Flapping+邻居频繁Up/Down | 路由源端 | 抑制震荡/检查邻居 |
五、实战案例
5.1 故障案例:AI 检测接口流量异常并自动定位
场景:某数据中心Leaf交换机100GE上联接口的入方向流量出现异常波动。
AI分析过程:
# 1. 采集Telemetry数据(10秒间隔)
telemetry_data = collect_telemetry(
    device="DC1-LEAF-05",
    interface="100GE1/0/1",
    metrics=['in_octets', 'out_octets', 'in_packets', 'out_packets'],
    duration=3600  # 最近1小时
)

# 2. 异常检测
detector = LSTMAnomalyDetector(sequence_length=60, features=4)
result = detector.detect_interface_anomaly(telemetry_data)

# 检测结果
# 异常比例: 45/360 = 12.5%
# 异常集中在 14:30 - 14:45 时间段

# 3. 多维关联分析
analyzer = NetworkAnomalyDetector()
# 同时检测CPU、内存、BGP等维度
multi_result = analyzer.detect(telemetry_data_multi)

# 发现:
# - interface维度: 异常(流量突增)
# - bgp维度: 正常
# - system维度: CPU使用率同步升高

# 4. 根因推理
# - 流量突增发生在同一VDC的所有Leaf交换机上
# - 时间窗口: 14:30开始, 与某个业务上线时间吻合
# - 根因判断: 业务发布后流量骤增, 非设备故障

# 5. 自动建议
# - 确认业务发布计划
# - 评估链路容量是否足够
# - 如为预期内增长, 调整监控基线
# - 如为异常流量, 检查业务配置/安全策略
AI分析结果: - 异常类型:流量突增(非设备故障) - 影响范围:同一VDC的5台Leaf交换机 - 根因判断:业务发布导致的预期流量增长 - 修复建议:确认业务发布计划,评估链路容量
5.2 故障案例:BGP 会话 Flapping 的 AI 根因分析
现象:某Spine交换机的BGP EVPN会话频繁Up/Down,关联告警超过50条。
AI分析过程:
# 1. 告警关联
correlator = AlarmCorrelationEngine(time_window=600)
alarms = collect_alarms(
    device="DC1-SPINE-01",
    time_range="last_2_hours"
)
groups = correlator.correlate_alarms(alarms, fabric_topology)

# 关联结果:
# Group 1: BGP Down (15条) + Interface Flapping (8条) + BFD Down (12条)
# Root Cause: Interface 100GE1/0/3 Flapping

# 2. 根因分析
root_cause = groups[0]['root_cause_alarm']
# Device: DC1-SPINE-01
# Interface: 100GE1/0/3
# Alarm: Interface Status Changed to Down
# First Occurrence: 14:15:23

# 3. 拓扑影响分析
affected_links = topology_query(
    interface="100GE1/0/3",
    query_type="downstream"
)
# 影响设备: DC1-LEAF-01, DC1-LEAF-02
# 影响服务: VDC_TenantA (3个VNI)

# 4. 修复建议生成
suggestion = generate_fix_suggestion(
    root_cause=root_cause,
    affected=affected_links
)
# 建议:
# 1. 检查接口100GE1/0/3物理连接(光模块/光纤)
# 2. 检查接口错误计数(display interface 100GE1/0/3)
# 3. 如确认光模块故障,执行光模块更换流程
六、总结
| AI能力 | 传统运维耗时 | AI运维耗时 | 效率提升 |
|---|---|---|---|
| 异常发现 | 30分钟(人工巡检) | 秒级(自动检测) | 1000倍+ |
| 告警降噪 | 1-2小时(人工归类) | 分钟级(自动关联) | 30倍+ |
| 根因定位 | 2-4小时(逐层排查) | 10-30分钟(自动推理) | 10倍+ |
| 容量规划 | 周级(手动统计) | 实时(自动预测) | 连续监控 |
| 实施建议 | 说明 |
|---|---|
| 数据先行 | 高质量的Telemetry数据是AI分析的基础 |
| 渐进落地 | 从异常检测→告警关联→根因分析,逐步推进 |
| 人机协同 | AI提供建议,人工确认和执行,积累反馈数据 |
| 持续迭代 | 根据实际运维反馈持续优化模型和规则 |
| 可解释性 | AI分析结果需提供推理依据,便于运维人员理解 |
思考
- AI异常检测模型需要大量历史正常数据训练,对于新部署的数据中心(缺乏历史数据),如何快速建立有效的异常检测能力?
- 在根因分析中,AI推理的置信度如何量化?当AI给出的根因判断置信度较低时,运维系统应如何降级处理?
- AI运维系统本身也可能出现故障或误判,如何建立对AI运维系统本身的监控和校验机制?
下篇预告:第287篇:网络切片(Network Slicing)基础